1
2
3
4
5
6
7
8
9
10
11
12
13
14
15
16
17
18
19
20
21
22
23
24
25
26
27
28
29
30
31
32
33
34
35
36
37
38
39
40
41
42
43
44
45
46
47
48
49
50
51
52
53
54
55
56
57
58
59
60
61
62
63
64
65
66
67
68
69
70
71
72
73
74
75
76
77
78
79
80
81
82
83
84
85
86
87
88
89
90
91
92
93
94
95
96
97
98
99
100
101
102
103
104
105
106
107
|
# Kraken Pro Cloud Alpha Note
This software is in ALPHA status. That means that all the intended features are not yet implemented, and that it may have multiple bugs. We also do not guarantee any uptime for this service at this time.
# Kraken Pro Cloud
[Kraken Pro Cloud](https://map.krakenrf.com) is our online cloud mapping solution for KrakenSDR devices. It allows you to upload KrakenSDR direction finding data onto our central server, so that you can combine bearing data from multiple geographically distributed KrakenSDR devices. With the right geography of the receivers and transmitter, this allows you to instantly determine the location of a transmitter without needing to take multiple readings with a vehicle.
## Geography and Positioning
At least two and ideally three or more KrakenSDRs spread out over some distance will be required. If you are detecting transmitters far away, the receivers will need to be spread out more in order to get good crossing of the bearings.
# Software Usage
Kraken Pro Cloud can be accessed by browsing to https://map.krakenrf.com. In order to sign up you will need to enter your email address, and have the serial number of any KrakenSDR that you own. This is the 8-digit number printed under the CE/FCC/UKCA/NoBinning logos on the front-right of the device.
**KerberosSDR Owners:** KerberosSDR owners are also welcome to use this software. However as the KerberosSDR does not have a serial number, please email us at thekraken@krakenrf.com with proof of ownership details. Be it a photo of the KerberosSDR with the current date, or an invoice. We will generate a serial number for you.
Once logged in your will be presented with a map and control sidebar.
## Adding a KrakenSDR
### Create a Remote SDR Station
To use the live bearing plotting features of the software you will need to add your KrakenSDR as a 'Remote SDR'. To do this, click on the `+` icon next to the Remote SDRs text.
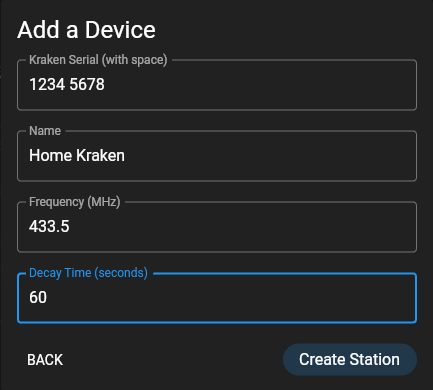
Enter the serial number of the KrakenSDR (don't forget the space), give it an easy to remember name (perhaps based on location), and enter a default frequency.
The decay time setting defines how long data from this KrakenSDR will contribute to the heatmap. Generally this could be anywhere from 10 to 120 seconds. Larger decay times result in more averaging over the grid space, and are useful if locating fixed stationary transmitters. Lower decay times result in more noise, but are required for moving transmitters.
Once you have the details entered, click `Create Station`.
You should now see the station added on the left sidebar. Click the gear icon next to the newly added station.
Under the device settings heading you should see an `APIKey`. Copy this value and store it for the next section.
Repeat these steps for as many KrakenSDRs as you are setting up. (During the alpha you are restricted to three maximum KrakenSDRs on the map)
### Setup your Local KrakenSDR Software
Next you will need to set up your local KrakenSDR software via it's Web GUI.
First connect to the KrakenSDR's web GUI via it's local IP address.
Under the `Station Information` settings box, enter a Station ID name and change the DOA Data Format to `Kraken Pro Remote`.
In `Kraken Pro Key`, paste in the `APIKey` that you got from the mapper in the previous section.
Change location source to `Static` and enter the Latitude, Longitude and Heading of the antenna array.
Now click the `Save Configuration` button at the top.
At this stage you now need to reboot your KrakenSDR.
## Starting the Mapper
To start visualizing data click on the button that currently says `local data`. This will switch it to the `remote data` mode.
After a few minutes you should see the DOA lobe and bearing lines on the map.
## Options and Features
### Main configure button (top right gear icon)
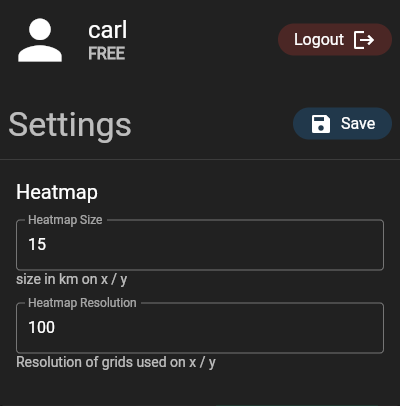
**Heatmap Size:** Total size from edge to edge in kilometers of the heatmap grid. Set appropriately for your expected search space.
**Heatmap Resolution:** Number of cells per axis on the grid. A higher value can result in more precise TX localization. But setting it too high can make offline logfile calculations too slow. Maximum resolution is currently capped at 500.
It's important to note that setting a smaller heatmap size naturally results in a higher resolution grid too. For example, if you set your grid to 100km and resolution to 500, each grid cell has a size of 100,000/500 = 200 x 200 meters.
Now if you set the grid size to 10km, each cell has a size of 20 x 20 meters.
### Double Click Menu
If you double click on the map a menu will pop up.
**Add Marker:** Adds a reference marker on the map. Useful for marking to location of known transmitters.
**Center Heatmap:** Centers the heatmap grid wherever you clicked.
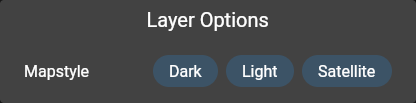
### Layer Options
Layer options can be accessed via the layers button  on the top left.
This allows you to choose between a light or dark street map, or a satellite image map.
## Loading an Offline Log Files
Kraken Pro Cloud can be used to visualize logs produced directly from the KrakenSDR core software created in the web GUI via the Local Data Recording feature, or for logs saved via the Android App.
To open a log file click on the folder icon under the 'Logfile' heading. Choose your .csv lolg file and click open.
After a few moments you should see the logfile load in. The heatmap calculation may take a few moments longer if the log file is large.
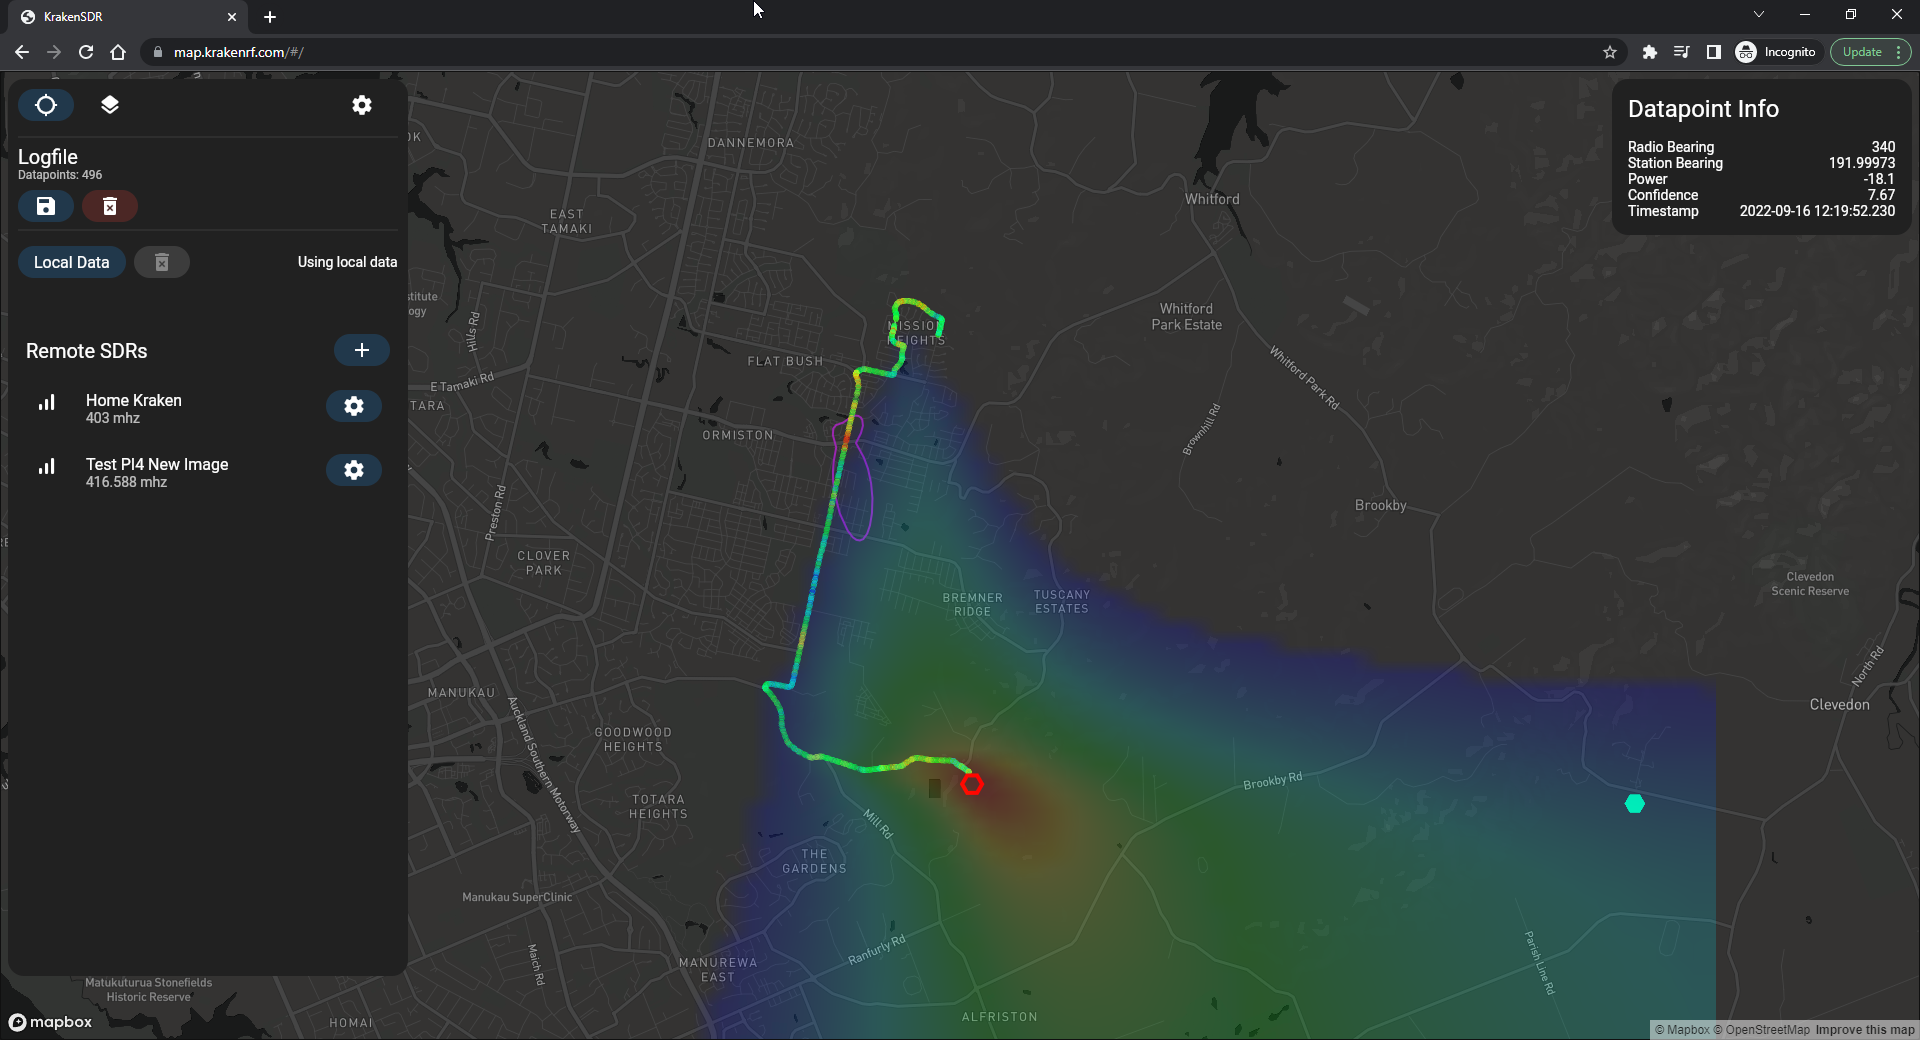
You can click on individual data points on the map for more information about that particular point, as well as a drawing of the lobe.
DOCS IN DEVELOPMENT
|
